
The Service Manager's Pay Plan
How the service lane pays you, what your DMS misses, and what the gap between the two is worth.
This report is for Service Managers whose variable pay is tied to numbers most of their tools can't fully measure.
We sit on a large service lane engagement dataset, and the patterns in it are useful whether or not you ever buy anything from us. If you're short on time, skip to the three-question diagnostic near the end. It takes about three minutes and tells you whether your shop is leaking the money your pay plan rewards.
The data is real, and every place a number describes a correlation rather than a controlled experiment is flagged as one.
The product mentions are at the end. If you skip them, the report still works.
Short on time? Two numbers you already know, and the one-page version of this report lands in your inbox with your position against the other stores selling your brand, and what the gap is worth.
That email doesn't look right.
Every Service Manager works for three bosses.
They rarely want the same thing on the same day, and when they conflict, you're the one in the middle of the lane.
The dealership
Wants throughput
- Gross profit on parts and labor
- Hours per repair order
- Effective labor rate
- Comeback rate held under 2%
The OEM
Wants depth
- CSI at or above national average
- Fix-right-first-time above 90%
- Every recall completed and documented
- Warranty claims clean enough to survive an audit
The customer
Wants speed and clarity
- Decides whether to approve the work
- Decides whether to come back
- Decides whether to write the review
- Not on your pay plan, and bends every metric on it
The variable component of a typical Service Manager plan runs 30 to 50 percent of total compensation, and it rewards hours sold per car, dollars per labor hour, customers who come back, and survey scores. Every one of those runs through the conversation between your advisor and your customer, the one part of the operation the DMS was never built to manage.
What your DMS tells you, and what it does not
Your DMS is very good at accounting. It can tell you almost anything about last month. It has much less to say about whether next month will be any good.
Your DMS knows
Available by lunch, to the decimal
- Repair orders closed last month
- Hours sold per RO, by advisor and by tech
- Effective labor rate by department
- Customer pay, warranty and internal gross profit
- Comeback rate
- Any of three dozen variations on the above
Your DMS does not know
The inputs your bonus actually depends on
- How long the advisor took to send the estimate after the tech finished
- Whether the customer saw a photo of the worn pad, or heard it described
- How long the customer took to approve, or declined work that should have been approved
- Whether anyone followed up on the work that was declined
- How many customers called between 8:30 and 11:00 and reached voicemail
- How many lapsed customers came back because someone reached out
- What your best advisor does in the first six minutes that your weakest does not
You're paid for outcomes that depend on a process you can't fully see.
None of this is a knock on the DMS. It does what it was built to do. But the industry spent thirty years measuring whatever was easy to pull, and left Service Managers to manage everything else on feel.
Hours per RO, the first lever
Hours per RO is the closest thing the service department has to a single executive metric. It rolls labor sales, technician productivity, advisor behaviour and customer approval rate into one number. Most pay plans include it directly, and the ones that don't include something downstream of it.
The trade publications will tell you the levers are technician proficiency, advisor training, the labor grid and the inspection process. None of that is wrong. It just isn't the whole list.
Across all 16,849,842 repair orders, those carrying a digital conversation averaged $455.08 in customer pay against $291.12 without one, a difference of $163.96 on every repair order. Sorting by how many messages were exchanged sharpens it considerably.
One caveat before you quote that number in a meeting. Larger, more complex jobs naturally generate more communication. There's simply more to talk about. This is a correlation, not a controlled experiment, and we're not claiming each additional message causes another sixty dollars of customer pay.
What we're saying is that a Service Manager who gets a meaningful share of their book to behave like the high-conversation set ends the year in a very different place than one whose book behaves like the single-message set. Even if engagement is half cause and half marker of complexity, the move is the same.
Your bonus is calculated on hours per RO. Hours come from labor lines, and labor lines get added when work is recommended and approved. Work gets approved when the customer can see what's being recommended and can act on it without phone tag. Every link in that chain runs through the conversation.
Size the gap at your store
A correlation across millions of repair orders is still worth sizing in dollars. You don't need proof of causation to want to know the shape of the gap, and how much of it you'd have to close to feel it on your pay plan.
You set the causal assumption, not us. Every other input is visible and adjustable too.
How much of the engagement gap do you believe is actually caused by the conversation, rather than by the job complexity that also produces the conversation? There's no right answer. Pick the one that matches your shop.
Annual incremental customer pay at your assumptions
lift on baseline revenue
gross profit at 52%
repair orders moved
The engagement gap is scaled by OEM tier using weighted average customer pay per RO, against a verified dataset median of $317.62. Every assumption above is yours to change, and the arithmetic is in the methodology.
Approval velocity, and the distribution
Hours per RO measures what got sold. Effective labor rate measures how well it got sold. ELR moves when the approval rate on premium recommended work moves, and that comes down to how the recommendation reaches the customer.
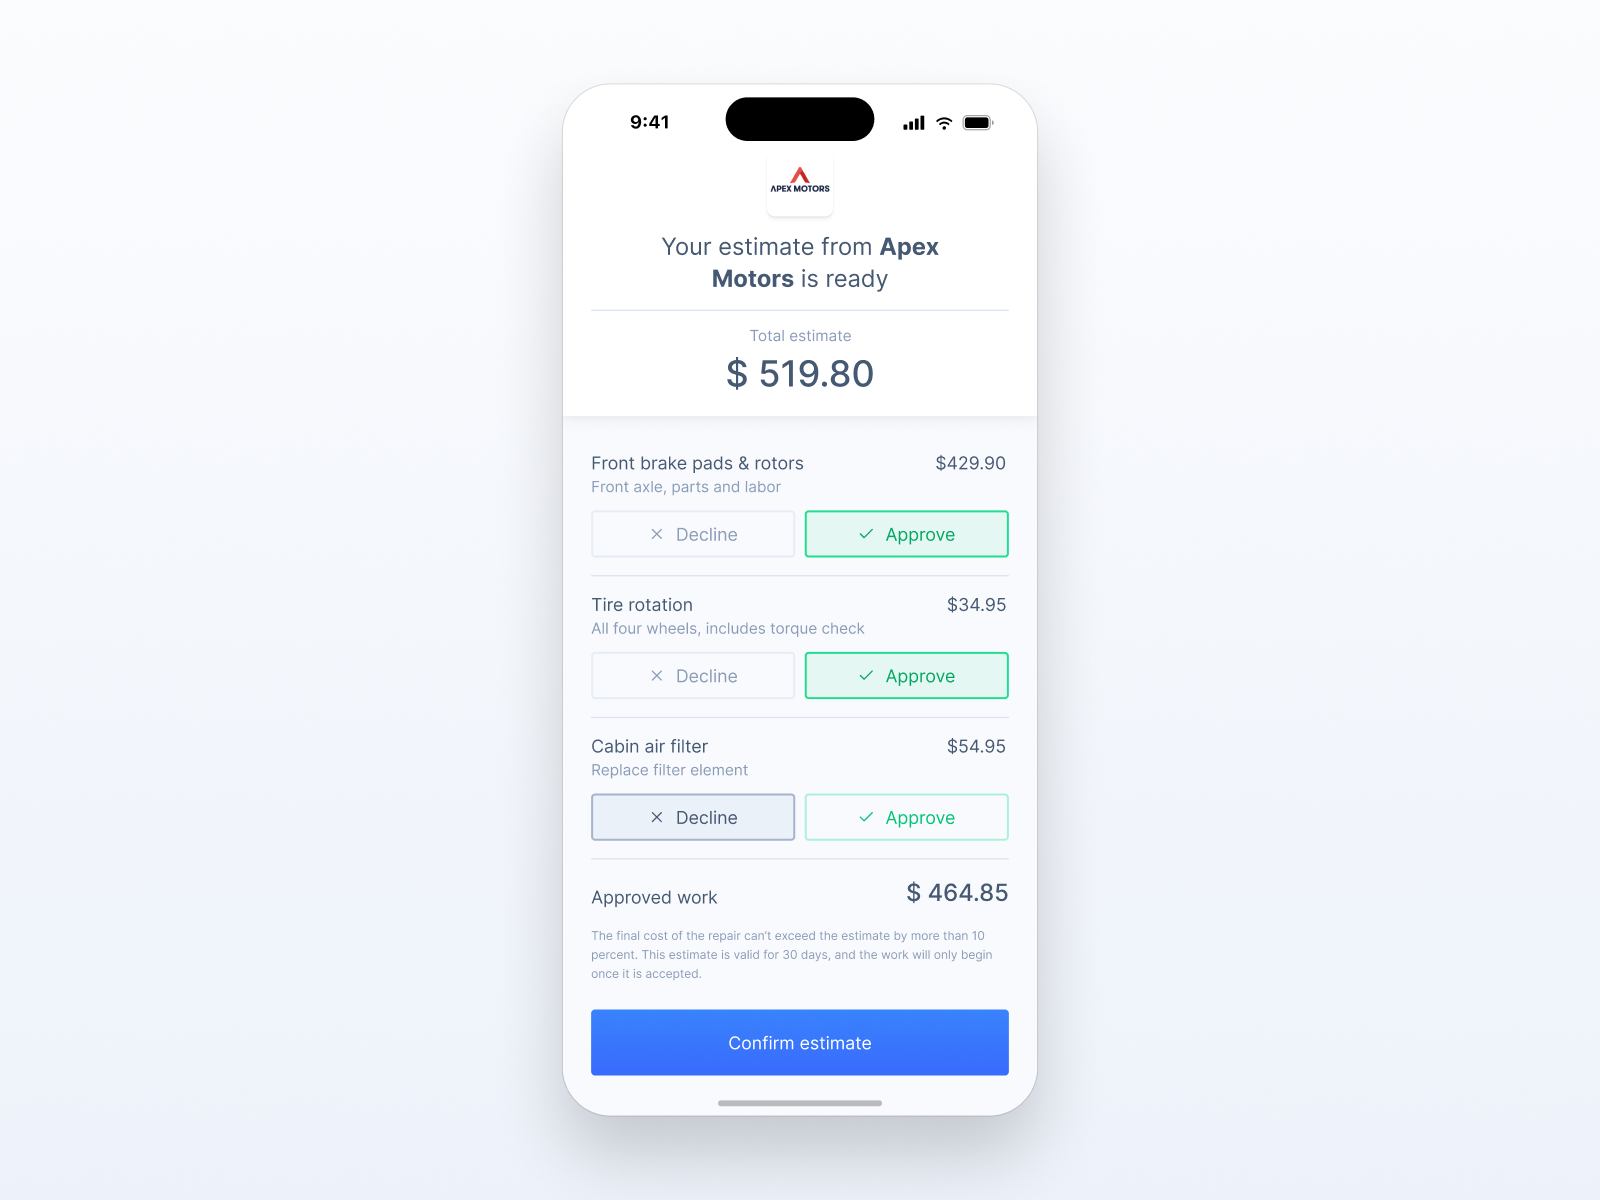
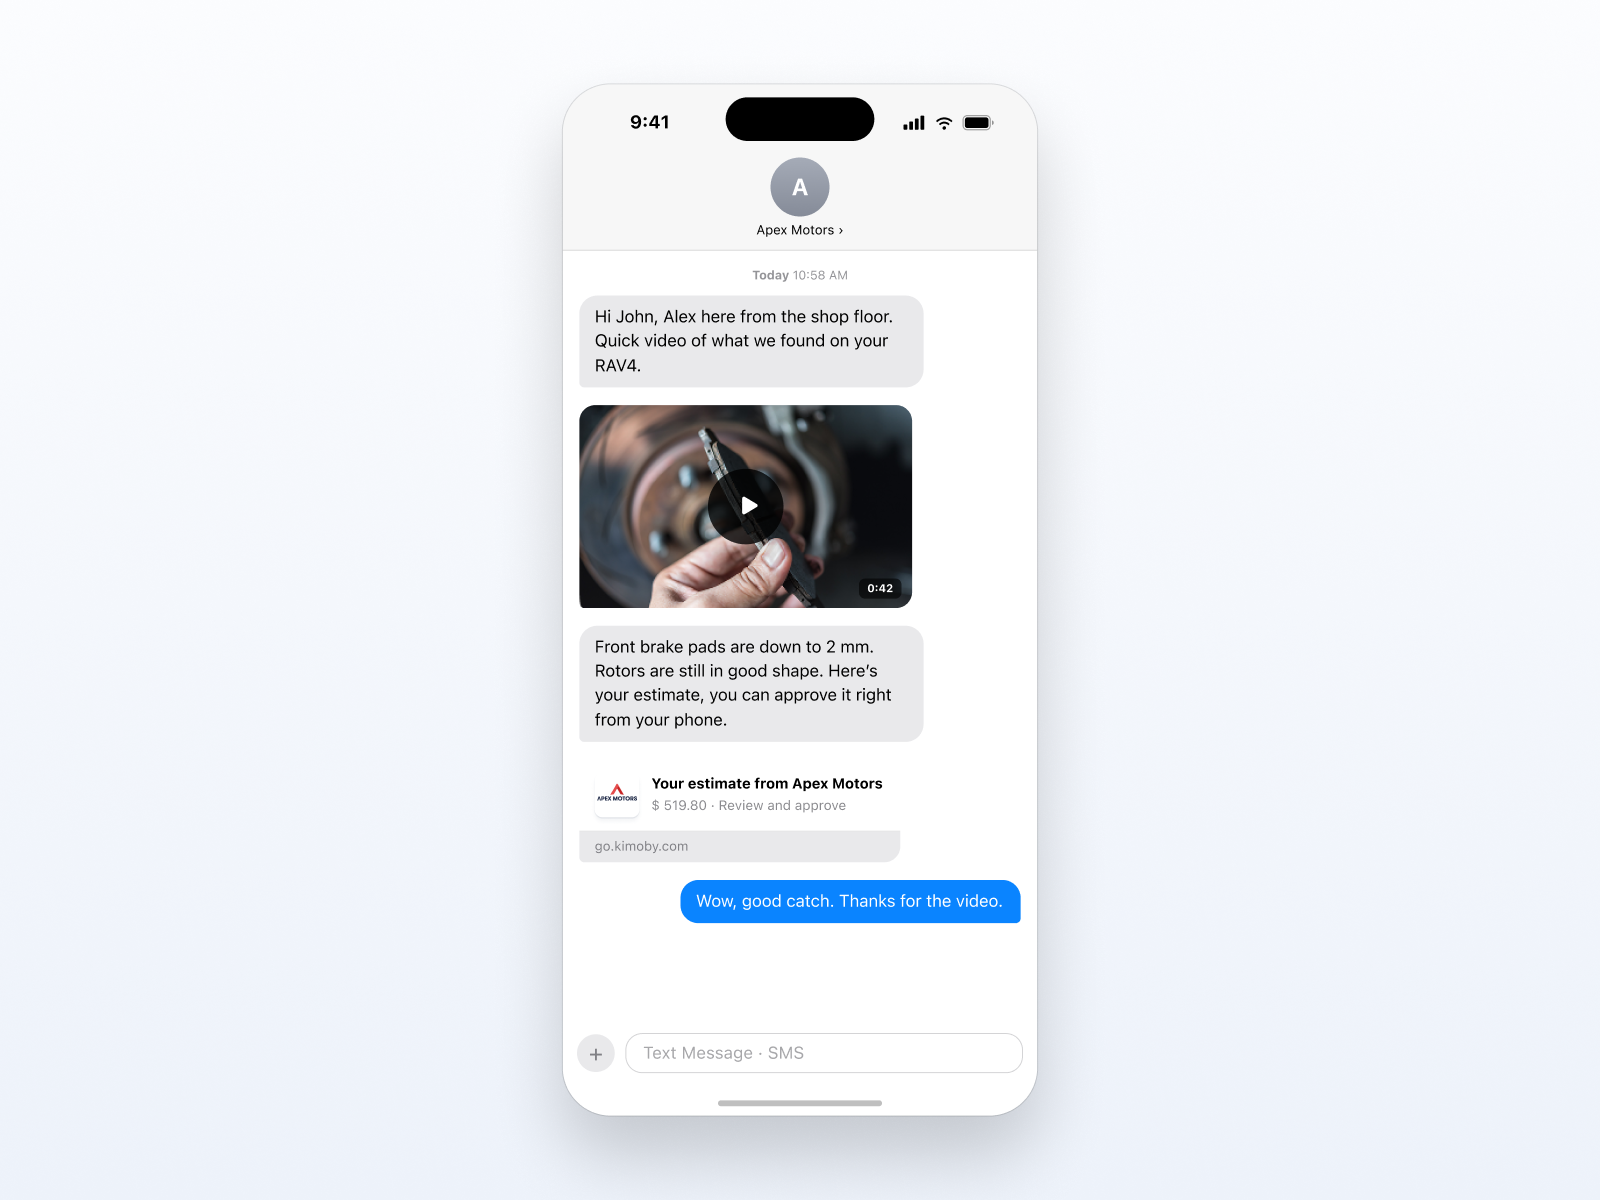
Customers answer fast when they can see what's being recommended, with photos and line items, on their phone. In minutes, in either direction. That hits your pay plan in three places.
ELR moves up
Higher-value lines get approved at a higher rate when the customer can see them. Customers don't decline expensive work. They decline unexplained work, which often happens to be expensive.
HPRO moves up
Faster approvals close the gap between the tech finishing the inspection and starting the additional work. That gap is the difference between a one-visit RO and a two-day RO.
Comebacks move down
A customer who approved with eyes on the photos remembers what she approved. The "I never authorized that" comeback is a documentation problem, and photos solve it.
Where the stores actually sit
Across 833 dealership accounts with at least 1,000 closed repair orders, average customer pay per RO varies enormously. Same brands, same labor grids, same flat-rate technicians. Move the slider to place your store.
Store-level percentiles across 833 accounts: P10 $196.32, P25 $240.79, median $317.62, P75 $427.35, P90 $560.54. The top decile averages roughly 2.9 times the bottom. Cost of goods, hiring and the labor grid don't explain a spread that wide. How the store runs the customer conversation does.
Your brand, your baseline
The all-brand percentile above is useful but incomplete. A Porsche store at the 25th percentile of Porsche stores still outperforms the median Honda store two to one. If you read that scale and concluded you were fine, you might be at the 25th percentile of your own brand.
The gap column is the spread between the 25th and 75th percentile within that brand. That range is decided by execution, not by the badge on the building or the market you're in.
Store-level percentiles across 833 accounts with at least 1,000 closed repair orders. These are medians of store performance, not repair-order-weighted platform averages, because you want to compare against a typical peer store rather than a volume-weighted mean. GM and Stellantis are grouped at the corporate level, so franchise brands like Chevrolet, GMC, Jeep and Ram sit under their corporate row. Brands with too few qualifying stores to publish are not listed here; the OEM tier model above still covers them.
Retention, the lever most pay plans leave out
Retention is the metric every Service Manager pay plan should include, and most don't, at least not directly. Some cap a comeback bonus, others tie a flat percentage to CSI, but few put retention on variable comp as its own line. That's slowly changing, because retention is the lagging indicator that separates shops with engagement handled from shops running on borrowed customers.
The clearest number in this dataset is what a returning customer is worth.
$549.28
is what a customer spends when they come back after thirteen months or more away. Every other repair order averages $320.76. They arrive with deferred work, and most of them only return because something reached out.
625,625 customers returned after that gap across the dataset, generating 714,259 repair orders. Reactivation runs between 1% and 7% of a store's volume, and the typical store sits at 4%.
By any standard industry definition those customers were lost. Winning them back requires no new customers, no new technicians and no negotiation with the OEM. It takes a list of people who stopped coming, and a calendar of when to ask again.
The engagement connection shows up consistently too. Customers whose repair orders included a digital conversation returned at a rate 6 points higher. Campaign recipients returned 9 to 10 points higher. Customers given a loaner returned 7 points higher. Each measured across more than 20,000 customers, each independent of the others. The standard confounder applies here too, since engaged customers may be more loyal to begin with. Still, three unrelated engagement types pointing the same direction at this scale is hard to dismiss. The people who heard from the store are the people who came back.
The tax you pay for silence
Most Service Manager pay plans contain a line item that never shows up in the DMS and rarely gets discussed until it hits. OEM franchise agreements tie allocations, co-op funds and volume bonuses to CSI, and at store level that lands directly in your variable compensation.
The structure varies but the pattern is consistent. Miss the threshold, lose money. Hit it, earn a bonus. A typical modifier swings quarterly variable comp by 10 to 25 percent in either direction, and on plans with a dedicated CSI bonus line the annual swing can exceed ten thousand dollars.
The connection to everything above is direct. CSI measures whether the customer felt informed, respected and attended to. A customer who got a digital estimate, a status update at the midpoint, photos with the inspection and a clear pickup confirmation spends more, and she also fills out the survey differently.
Annual compensation riding on your CSI score
The figure above assumes the modifier works in both directions. In manager plans it often doesn't. A recurring design in publicly posted plans deducts money for missing a KPI target while offering nothing for beating it, and managers flag it as a flaw without being prompted. Two commenters on the same posted plan hit it independently. One noted the deduction only punishes a miss and pays nothing for a beat. The other said plainly that they dislike negative CSI deductions because there's no bonus for good results.
So before treating your CSI modifier as upside, read the plan language and find out whether the upside actually exists. A penalty-only modifier isn't a bonus you can earn. It's a fine you can avoid.
The lever is whether the customer felt informed before the survey arrived. Fix the communication and the score follows. CSI mechanics described here are drawn from publicly posted pay plans, which are self-reported and self-selected.
The problem sits underneath the people
The natural instinct is to treat this as a people problem: train the advisors harder, hire someone for the phones, run a campaign once a quarter, put up a sign about CSI. Those are patches, and in the data they don't move the metric, because nothing underneath them has changed.
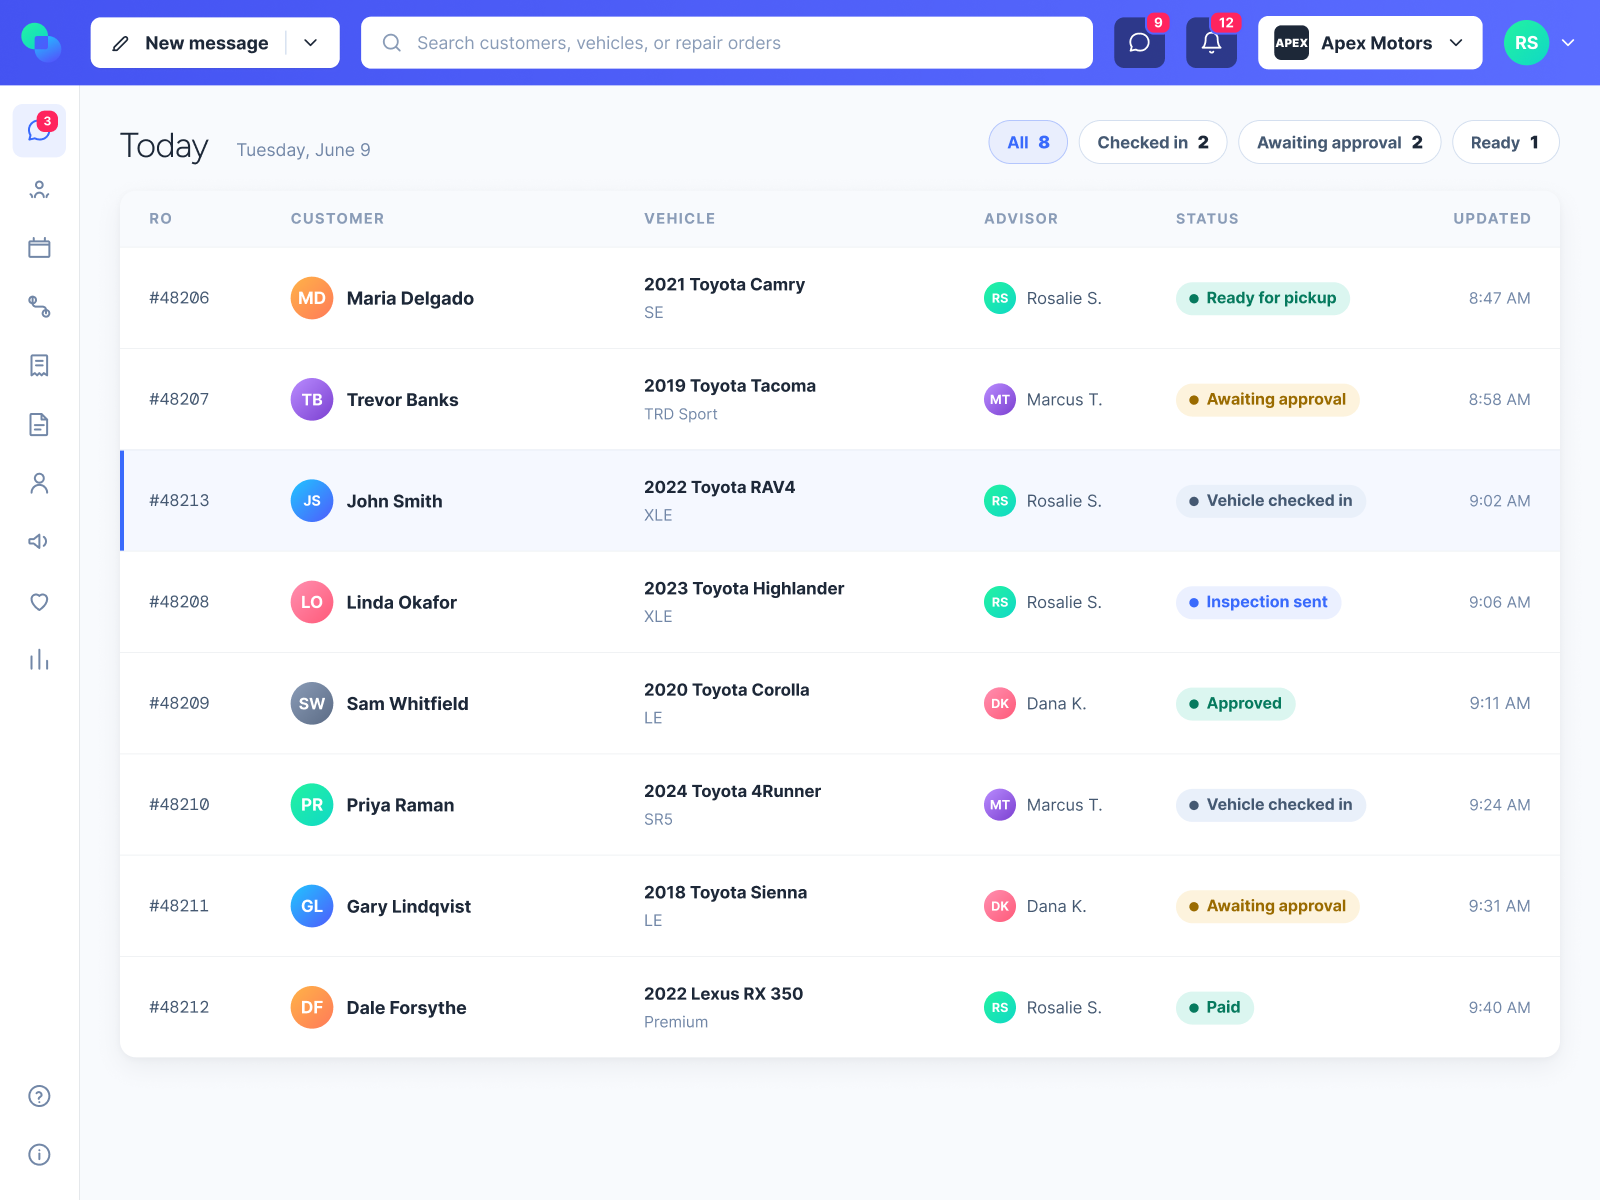
The service lane runs on infrastructure designed for a different job. The DMS is precise and rigid, and it tells you what happened. The lane also needs something for the fast, human part: estimates, inspections, approvals, status updates, payment, lapsed customer outreach, loaner management. The conversation, captured and connected to the repair order.
You can't bolt that onto the DMS, and a texting tool doesn't cover it either. Every point solution adds a login and a tab, until the advisor runs five systems instead of one and the customer experience falls through the seams between them.
The DMS, the slow clock
Precise and historical, organized around what already happened. A system of record.
The service lane, the fast clock
Chaotic and human, organized around what happens next. Most dealerships run it on nothing at all.
The slow clock has had a name for decades. The fast clock hasn't, which is part of why most dealerships have never bought one. We call it a Dealership Engagement System (DES)™: a single platform running the entire service lane customer interaction, from drop-off through inspection, estimate, approval, payment and follow-up, connected to the DMS but distinct from it.
Four moves, and what they stack to
Each move below was sized independently against the data. Tick the ones you're not already running. The total discounts 17.5% for overlap, because a first-visit customer receiving a digital estimate is counted in two of them.
Annual incremental customer pay, after overlap discount
$0
Nothing ticked yet. Select the moves you are not running today.
What all of that is worth on your paycheck
Everything above is the store's revenue. This is the share that reaches you. Tell it how your plan is shaped and it'll work out what the moves you selected are worth in your variable compensation this year.
First, which job do you actually have?
"Service manager" covers at least two roles with different pay logic, and the difference is big enough that mixing them up makes any benchmark useless.
Lane manager
$80,000 to $100,000
A hybrid role. Still writing repair orders, still on the drive, taking fewer appointments but active in inspection and delivery. Pay lands close to top-advisor money because the work is close to advisor work. One poster described taking a $15,000 pay cut moving from advisor into this seat.
Department manager or service director
$150,000 to $200,000
Full profit and loss ownership of the department. This is the role the rest of this report is written for, and the role the model below assumes. If you're a lane manager, treat the output as the department's gain rather than yours.
Community-reported bands from a single manager thread, with regional variance noted by the posters. Directional, not a validated statistic.
See what this is worth to you
Your variable compensation impact from the moves you selected, and separately from the rate escalation if the same work carries you over your CSI target. Plus a one-page summary with the arithmetic laid out, which is the version worth having in front of you at your next plan review.
That email doesn't look right.
Additional variable compensation, annual
Gross or net. Check which one before you sign anything.
Service managers on public forums warn about this more consistently than any other pay plan issue. Paid on gross, your commission tracks what the department produces. Paid on net, it tracks what's left after expenses you don't control. One manager reported their highest sales month producing a lower commission than usual because of undisclosed costs charged against the department. Another put it bluntly: on net terms you end up covering all expenses, including the owner's vehicles and renovations.
"If I grow the department, they'll just rewrite my plan."
This is the first thing an experienced Service Manager says to a model like the one above, and the concern is not paranoid. The clearest public evidence for it comes from advisors rather than managers, so read it as the pattern rather than as your own numbers: a top advisor at a high-volume import store had their pay cut 30 percent, and the stated reason was that they were earning too much. Another store rewrote the plan after a record month. One advisor described the plan changing eight times in seventeen years, each version paying less. Another watched annual income fall from $90,000 to $50,000 across three revisions.
Whether it happens as readily at the manager level, we can't show with the same evidence. The risk is real enough that experienced people plan around it, and this report can't price it. What it can do is name two things that seem to change the odds.
First, measurement changes the conversation. A plan gets cut quietly when nobody can attribute the growth. It's harder to cut when the manager can show which specific changes produced which specific gross, which is what the three-question diagnostic is for. Second, portability. The same threads that describe plans being cut also describe advisors and managers leaving for stores that pay properly. A documented record of moving a department's numbers travels with you.
Gross profit on the moves above is taken at a blended 52% of customer pay, parts plus labor, which is an assumption rather than a measured figure. The rate range of 1 to 4 percent of department gross, the rate-escalation-on-CSI structure, and the gross-versus-net caution are drawn from publicly posted service manager pay plans. Manager plans are posted far less often than advisor plans, so that sample is small, self-reported and self-selected. Treat it as the shape of the market rather than a benchmark, and note that where this report draws on advisor evidence instead, it says so.
The three-minute diagnostic
If you can't answer all three about your shop today, you have a measurement gap. Everything above is what that gap costs.
1. What is your average customer pay per RO on repair orders with a digital estimate sent, versus those without?
2. What is your median time from estimate sent to customer approval?
3. How many lapsed customers did your shop bring back last year through proactive outreach, and what did they produce?
Answer the three above
If your DMS can't answer these, the data isn't hidden. It was never captured. The conversation never made it into a system at all.
You run a 2026 service department on infrastructure designed in the 1990s, and you're paid on outcomes that infrastructure can't see.
The conversation between your dealership and your customer is the least instrumented, most leveraged part of the business. Move it and your hours per RO move. So does your effective labor rate, your retention, and your CSI.
The gap is already on your pay stub. Closing it is a decision.
Methodology and limitations
Platform data covers 871 dealership accounts on the Kimoby Service Lane OS that wrote at least one repair order in the twelve months ending February 2026, totalling 16,849,842 closed repair orders and 4,436,882 distinct customers. Kimoby built the system that captured it. We're the vendor, and the limitations below follow from that.
On causation
The engagement findings are observed patterns, not controlled experiments. Repair orders with more conversation are not randomly assigned; they are larger, more complex jobs that naturally generate more communication. That's why the model above asks you to set the causal share rather than asserting one. Job complexity, vehicle age, brand mix and geography are all uncontrolled confounders.
On the conversation-depth cut
The one-message, two-to-three and four-or-more breakdown covers the 3,999,540 repair orders that carried at least one message, which reconciles with the 3,999,548 identified as having a digital conversation in the headline comparison. Repair orders with no conversation at all are excluded from the depth buckets by definition; they appear in the headline figure, where all 16,849,842 repair orders split $455.08 with a conversation against $291.12 without, a difference of $163.96.
One limitation worth stating: messages carry no repair order identifier in the source data, so message counts are rolled up to a repair order through the customer record rather than a strict per-visit window. The buckets should therefore be read as directional. The ordering is unambiguous, the exact boundary between two and three messages is not.
On the store distribution
Store-level percentiles are computed across 833 accounts with at least 1,000 closed repair orders in the window: P10 $196.32, P25 $240.79, median $317.62, P75 $427.35, P90 $560.54. The top decile averages roughly 2.9 times the bottom decile. Brand tables use the same account population.
On the brand tables
Brand figures are store-level percentiles, not repair-order-weighted averages. A franchise selling more than one brand will sit between its brands' figures, and stores with unusual job mix will sit outside their brand's range for reasons unrelated to communication. The benchmark is the start of a conversation, not a verdict.
On the playbook sizing
Each move is sized at a reference store of 8,300 customer pay repair orders on the domestic baseline of $351 per RO, using the same movable share (40%) and moderate causal assumption (25%) as the model above, then scaled 1.60x for European luxury, the ratio of the $562 and $351 tier baselines. Digital estimates: 8,300 x 40% movable x $280.33 observed conversation gap x 1.105 baseline scale x 25% causal, roughly $257,100, which matches the model above at its default settings by construction. First-visit protocol: 1.86 million of the 16.8 million repair orders were first visits carrying a conversation (11%), and 82% of those carried a single message, so 8,300 x 11% x 82% x 40% x the $439.31 first-visit gap x 1.105 x 25%, roughly $36,300. Declined-work follow-up uses the recovery that top-decile stores in this dataset actually achieve, $30,685 a year, deliberately not tier-scaled. Lapsed-customer reactivation is 534 returning customers per rooftop at a $530 average repair order, $283,000, also not tier-scaled. The 17.5% overlap discount then removes double counting between the first two moves.
On what we could not find
Three independent searches of publicly posted pay plans failed to surface a single service manager plan documenting tiered CSI bonus thresholds in dollars. Advisor threads routinely provide that granularity, listing exact bands and rates. Manager threads do not. We're reporting that as a stable finding rather than a search limitation: if a manager-side CSI tier benchmark exists, it is not publicly discussed at any useful volume, and any report quoting one should be asked where it came from.
This is why the model above uses rate escalation, which managers do describe, rather than cliff bonuses, which they do not.
On retention
This edition reports reactivation rather than a cohort retention rate. 625,625 customers returned after an absence of thirteen months or more, generating 714,259 repair orders at an average of $549.28 in customer pay against $320.76 for all other repair orders. A NADA-comparable cohort figure is being re-derived and will appear in a future edition rather than being published before it reconciles.
On the phone
Inbound service calls remain the largest unmeasured loss surface in the department. Marchex call analytics put unanswered inbound automotive service calls at 20 to 30% of volume, clustered in the morning drop-off window when advisors are least able to pick up. Platform-wide voice figures are being collected, so the phone is deliberately absent from the revenue model above rather than estimated.
On the source
This data comes from one vendor's platform, which is both why it exists at this scale and a limit on how it should be read. Kimoby customers are self-selected: dealerships that chose to invest in service lane engagement are unlikely to represent dealerships generally. Read the absolute numbers as what is achievable by stores already committed to this, not as an industry average.
Industry benchmarks cited
NADA, Cox Automotive 2025 Service Industry Study, J.D. Power 2024 and 2026 U.S. Customer Service Index studies, J.D. Power 2024 U.S. Aftermarket Service Index Study, TVI MarketPro3, and Marchex call analytics.
© 2026 Kimoby Inc. All rights reserved. Dealership Engagement System (DES)™ is a trademark of Kimoby Inc.