
The Cost of Silence
What dealership service departments lose when the customer hears nothing. Based on 871 dealerships, 16.8 million repair orders, and $5.5 billion in customer pay.
Published August 2026 · Platform data covers the 12 months ending February 2026
Key findings
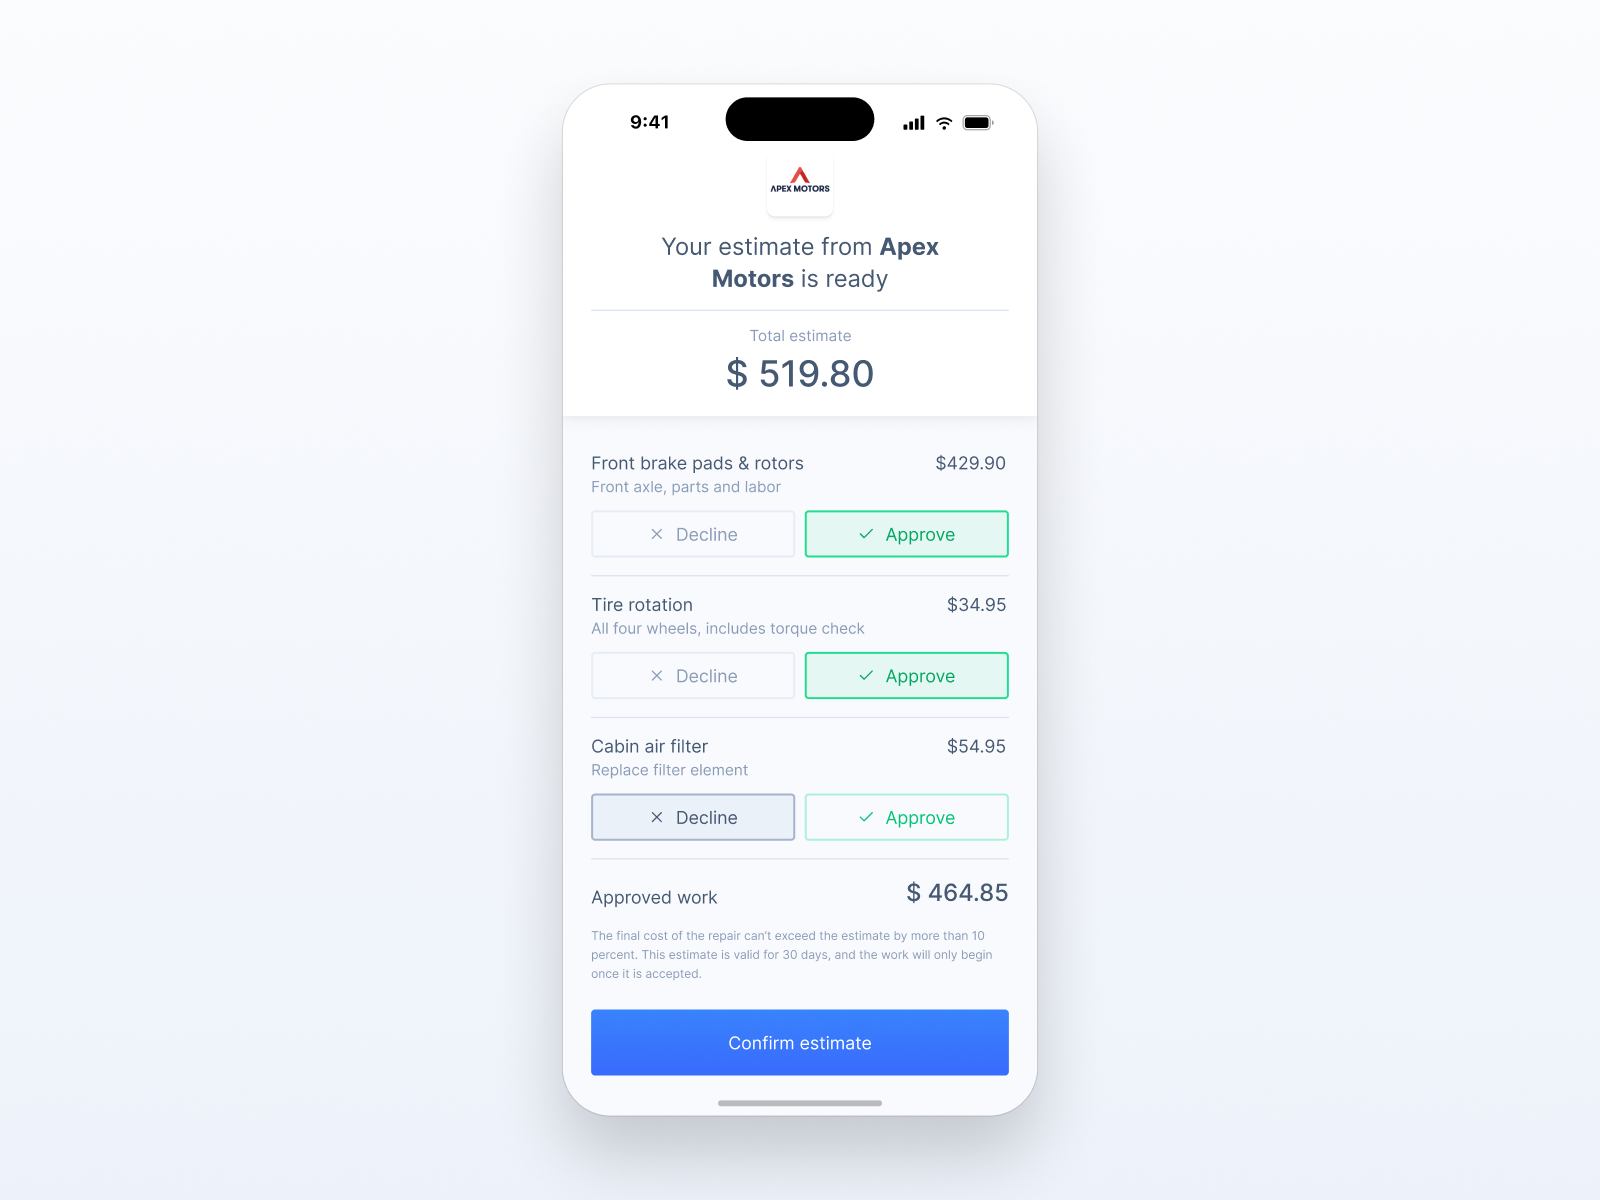
- Digital estimates are approved in a median of 6 minutes. Phone-based approvals average 22 to 23 hours.
- Repair orders with a digital customer conversation averaged $455.08 in customer pay, against $291.12 without one. A gap of $163.96 per repair order.
- 76.3% of repair orders across the platform still close with no digital conversation attached.
- 64% of service customers want photo or video with their inspection. Only 26% of mass-market customers receive it (J.D. Power, 2026).
- A customer returning after 13 months or more spends $549.28, against $320.76 on every other repair order.
- Average customer pay per repair order ranges from $217.40 at Kia stores to $966.41 at Porsche stores, a 4.4x spread before anyone changes anything.
Short on time? Two numbers you already know, and the one-page version of this report lands in your inbox with your brand's average and your own gap against it worked out.
That email doesn't look right.
Six minutes.
That's the median time it takes a customer to approve additional work when the estimate lands on their phone. On the phone, the same approval averages 22 to 23 hours.
Same customer, same repair. The only difference is whether they could see what the advisor was talking about.
Where the silence happens
Every repair order passes through six moments where the dealership either says something or doesn't. We've priced each one. Keep scrolling, they advance one at a time.
20–30% unanswered
4 of 5 ROs touched by a missed call
64% want photo or video, 26% get it
6 minutes against 23 hours
4.7% of ROs get a payment request
Returning customers spend 1.7x
Moment 1 of 6
It starts before the repair order exists
Between a fifth and a third of inbound service calls go unanswered, and they cluster in the morning drop-off window, right when advisors are least able to pick up. A missed call doesn't leave behind a declined estimate or a lost RO. It leaves nothing at all, which is a big part of why it has gone unpriced for so long.
Marchex call analytics.
The write-up inherits whatever the phone lost
At one store that started counting, four out of five repair orders had involved at least one missed call. Nobody at the dealership knew that until they actually measured it.
Gary Moe Mazda Lethbridge, after deploying Kimoby Voice.
The technician finds something, and the customer can't see it
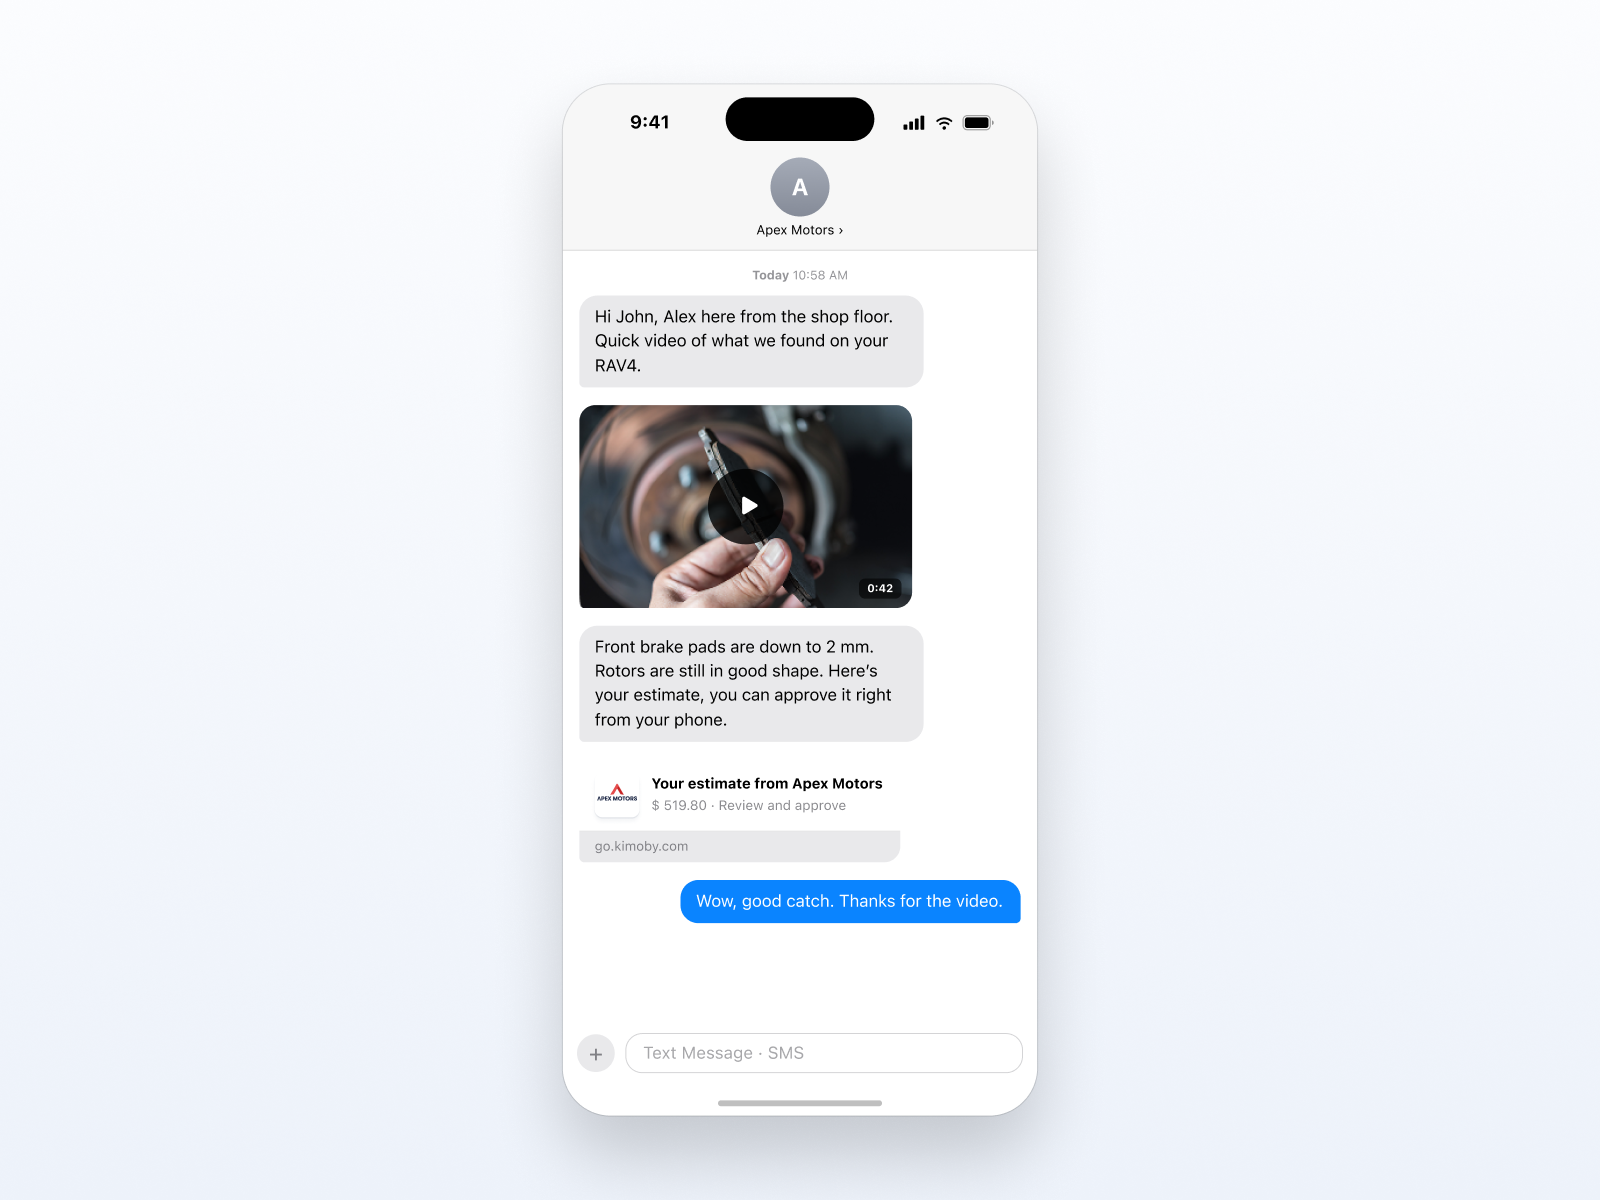
64% of service customers want photo or video with their multi-point inspection. Among mass-market brands, 26% receive it. Most customers are asking for something most of them never get.
J.D. Power 2026 U.S. Customer Service Index Study.
The approval is where hours disappear
A digital estimate with photos and one-tap approval comes back in a median of six minutes. A phone-based approval averages 22 to 23 hours. Voicemail, callbacks, the car sitting on a lift with the bay blocked the whole time.
Platform median against industry average.
Payment adds friction nobody counts
Only 4.7% of repair orders currently trigger a digital payment request, even at stores that have the capability switched on. Everything else is a trip to the counter or a card number read out loud, 15 to 30 minutes at a time.
Platform data, 12 months.
And then the silence keeps costing
There's the declined work nobody follows up on, and the customers who quietly stop coming. A customer who returns after thirteen months or more spends $549.28 on that visit, against $320.76 on every other repair order, and they come back with deferred work. Most of them only come back because someone reached out.
Platform data, 12 months across 871 dealerships.
Most dealerships have never measured this, because the systems they run on were never built to measure it. A DMS records that a repair order opened at 9:14 and closed at 4:47. It has nothing to say about the four hours in between when the car sat on a lift, finished with the oil change, waiting on a customer who hadn't yet been reached.
The dataset behind this report covers 871 dealership accounts, 16,849,842 repair orders, and $5.5 billion in customer pay across the 12 months ending February 2026.
871
dealership accounts
16.8M
repair orders analyzed
$5.5B
customer pay covered
What silence actually looks like
Start with what customers want, because on this point there's clean third-party data to lean on.
J.D. Power's 2026 U.S. Customer Service Index Study found that 64% of service customers want photo or video documentation alongside their multi-point inspection. Among mass-market brands, 26% get it. Among premium brands, 44%.
Photo or video with the inspection
Source: J.D. Power 2026 U.S. Customer Service Index Study.
Roughly two out of three customers are asking for something three out of four never receive. The number is J.D. Power's, not ours.
Inside the lane it looks messier, and harder to put on a report.
An advisor calls, gets voicemail, tries again between customers, and by the time the phone is answered the bay has been idle four hours. Nobody logs any of it.
Or the estimate happens verbally. Brakes are getting thin, there's a coolant leak, probably around twelve hundred. No photo, no line items, nothing to look at. The customer declines, mostly on reflex. It was never that she couldn't afford $1,200. She couldn't see it.
None of this is a discipline problem. It comes from running live customer relationships out of software built to keep the books.
The calls that never became repair orders
Everything in the rest of this report concerns repair orders that exist. This section is about the ones that don't.
Marchex call analytics put unanswered inbound automotive service calls at 20 to 30% of total volume, concentrated in the morning drop-off hours.
A missed call is a different kind of loss than a slow approval. A slow approval is revenue delayed and a bay tied up. A missed call is a customer who wanted to give you money and couldn't find anyone to take it, and it leaves no record. As far as your reporting is concerned, it never happened. That's a big part of why it has gone unpriced for so long.
We can put real numbers on it from one store. Gary Moe Mazda in Lethbridge, Alberta deployed Kimoby Voice in mid-2026.
4 of 5
repair orders previously involved at least one missed call
240
missed calls a month now handled automatically
12 hrs
advisor time recovered monthly from callbacks and voicemail
"Before this, I was seriously looking at hiring someone just to handle our inbound calls. A few months in and I'm really glad we went with this instead."
Andrew Lusignan
Service Manager, Gary Moe Mazda Lethbridge
One store is one store, and we're not going to multiply 240 calls a month across 871 rooftops and call the product a finding. But the ratio underneath it deserves attention: four out of five repair orders touched by a missed call, at a store that had no idea until it started counting.
The velocity tax
Silence has a cost today, on the repair orders currently in your lane. Every hour of dead air is an hour a bay stays blocked and a ticket stays open.
What is the revenue difference between repair orders with and without a digital conversation?
+$163.96 per repair order
Average customer pay gap between repair orders with a digital conversation and those without, measured across 16.8 million ROs.
$455.08 with, against $291.12 without. A 56.3% difference across 3,999,548 conversation-linked repair orders. Bigger jobs naturally generate more conversation, so this is an observed pattern, not a causal claim.
How many repair orders actually get a digital conversation?
Each dot is one repair order in a hundred, at platform scale.
3,999,548 repair orders with a conversation against 12,850,294 without, over twelve months.
The threshold
Coverage doesn't pay off gradually. Sorting stores by how much of their volume carries a digital conversation, those below roughly 7% show a customer pay gap of only $74 between their conversation and non-conversation repair orders. Above 7%, the gap jumps to about $215 and then holds steady all the way to 88%.
Below that line, a digital conversation happens by accident, not by process. Stores that tried texting for a month, saw nothing, and gave up weren't wrong about what they saw. They just never got over the line where it starts to pay.
How fast do customers approve work when the estimate arrives digitally?
The median digital approval lands in six minutes. The phone-based average is 22 to 23 hours. Run it and watch the difference.
What is a photo actually worth on an inspection?
Approved and declined inspections are not the same size of job. Toggle between them.
$628.61
Average value of an inspection the customer approved.
A number read out over the phone sounds like an upsell. A photo of a worn pad next to a new one, with a price attached, sounds like evidence.
What happens once a store starts sending video?
Digital inspection volume across the platform, roughly 13-fold growth over eight months. Only the two endpoints are measured, so the months between are not shown.
The compounding loss
The velocity tax is what you feel this week. The rest compounds quietly and shows up later as a trend line nobody can trace back to a cause.
Most dealerships treat a declined repair as a closed conversation. Stores running digital estimates can turn a decline into a trigger instead. There's no meaningful industry benchmark for declined-service recovery rate, partly because you can't benchmark a number no system produces.
Where does retention actually land?
The eight-point spread between 65.8% and 73.9% is what outreach buys. It counts the customers who came back because someone reached out instead of waiting.
$549.28
is what a customer spends when they return after thirteen months or more away. Every other repair order averages $320.76. They come back with a list of deferred work.
Across 871 stores, reactivation accounts for between 1% and 7% of repair order volume. The typical store sits at 4%.
+6 points
retention lift with a digital conversation on the RO
+9 to 10 points
retention lift among campaign recipients
+7 points
retention lift among customers given a loaner
Each measured separately, each across samples above 20,000 customers. These are correlations, and we're not going to dress them up as anything else. But three unrelated engagement types all pointing the same direction, at that scale, is worth taking seriously.
The benchmark
Every number so far has been a platform-wide average. An average is the wrong tool for a benchmark, because what a repair order is worth depends enormously on what you sell.
How does your store compare to others selling the same cars?
Average customer pay per repair order runs from $217.40 at Kia stores to $966.41 at Porsche stores. That is a 4.4x spread across thirty brands, before anyone does anything differently, which is why a platform average is close to useless as a benchmark. Two numbers you already know and your brand, compared against stores selling the same cars.
Brand figures are repair-order-weighted averages across 16,849,842 repair orders, twelve months ending February 2026. Franchises with mixed brand mix will sit between their brands' averages.
See how your store compares
Unlocks the average for your brand, what your gap against it is worth over a year, what it says about your conversation coverage, your reactivation upside, and the full table of all thirty brands below.
That email doesn't look right.
What that number implies
The other lever
A customer returning after 13 months or more spends $549.28, against $320.76 on every other repair order. The typical store reactivates 4% of its volume. The top decile reaches 7%.
Every brand, measured
The calculator compares you against one brand. The spread across all thirty is the part most dealers have never seen, and it's what makes a platform average misleading.
| Brand | Avg customer pay per RO | Against platform average |
|---|---|---|
| Porsche | $966.41 | 296% of platform average |
| Land Rover | $763.64 | 234% of platform average |
| Mercedes-Benz | $621.48 | 190% of platform average |
| MINI | $522.29 | 160% of platform average |
| Volvo | $513.17 | 157% of platform average |
| BMW | $477.84 | 146% of platform average |
| Audi | $461.97 | 141% of platform average |
| Dodge | $436.51 | 134% of platform average |
| Lexus | $396.27 | 121% of platform average |
| Ram | $384.16 | 118% of platform average |
| Acura | $369.89 | 113% of platform average |
| Ford | $360.07 | 110% of platform average |
| Subaru | $338.78 | 104% of platform average |
| Infiniti | $336.59 | 103% of platform average |
| Chrysler | $323.07 | 99% of platform average |
| Cadillac | $307.44 | 94% of platform average |
| Hyundai | $305.36 | 94% of platform average |
| GMC | $303.12 | 93% of platform average |
| Chevrolet | $297.18 | 91% of platform average |
| Volkswagen | $295.13 | 90% of platform average |
| Honda | $294.12 | 90% of platform average |
| Jeep | $292.58 | 90% of platform average |
| Mitsubishi | $291.38 | 89% of platform average |
| Mazda | $278.61 | 85% of platform average |
| Toyota | $278.54 | 85% of platform average |
| Nissan | $261.14 | 80% of platform average |
| Genesis | $251.17 | 77% of platform average |
| Buick | $242.75 | 74% of platform average |
| Lincoln | $219.64 | 67% of platform average |
| Kia | $217.40 | 67% of platform average |
All 30 brands, $217.40 to $966.41. Unlocks with your result above.
Repair-order-weighted averages by vehicle make across 16,849,842 repair orders.
What does "not silent" measure out to?
| Metric | Top-performing stores | Industry default |
|---|---|---|
| Conversation coverage | 60% of ROs | 1% at the 10th percentile |
| Customer reply rate | 35% of outbound | not measurable |
| Median estimate approval time | 6 minutes | 22 to 23 hours (phone) |
| Reactivation rate | 7% of volume | 1% at the 10th percentile |
| Digital payment share | 82.5% mobile | close to 0% |
The right column isn't really a benchmark. Most dealerships can't produce a figure for conversation coverage per repair order, because nothing in their stack generates one.
Three questions to ask your own store
1. What is your average customer pay on repair orders with a digital conversation, versus without?
2. What is your median time from estimate sent to customer approval?
3. How many customers who had lapsed past a year did you bring back this year through outreach?
Answer the three above
If the honest answer to all three is "I don't know," that's the silence this report is about. Across 871 dealerships, the stores that can answer these questions are consistently the ones earning more per repair order.
Why this is structural
The instinct is to fix this with people. Train the advisors harder, hire someone for the phones. That's a patch, and the data says patches aren't enough, because the problem sits underneath the people.
The DMS was never built for this. It records every dollar, part number, labor hour and warranty claim precisely. What it doesn't know is what the advisor told the customer, when the estimate went out, whether the customer saw a single photograph, or whether anyone circled back on the work they declined. That's not a defect. It was built for accounting, not for a live conversation moving at the speed of a service drive.
Point solutions don't close the gap either. A texting tool fixes messaging and leaves the estimate alone. An inspection tool fixes visibility and stops short of approval. Each one adds another login and another tab, until the advisor is running five systems and the customer experience falls through the seams between them.
The DMS, the slow clock
Precise and historical, organized around what already happened. A system of record.
The service lane, the fast clock
Chaotic and human, organized around what happens next. Most dealerships run it on nothing at all.
Dealerships have spent twenty years trying to run the fast clock on the slow clock's gears. The slow clock has a name: system of record. The fast clock has never had one.
A Dealership Engagement System (DES)™ is a single platform that runs the entire service lane customer interaction, from drop-off through inspection, estimate, approval, payment and follow-up, connected to the DMS but distinct from it. The system of record tells you what happened. A Dealership Engagement System tells you what to do next.
It's not a texting tool bolted on, or a DMS module, or a chatbot.
What 871 dealerships demonstrate
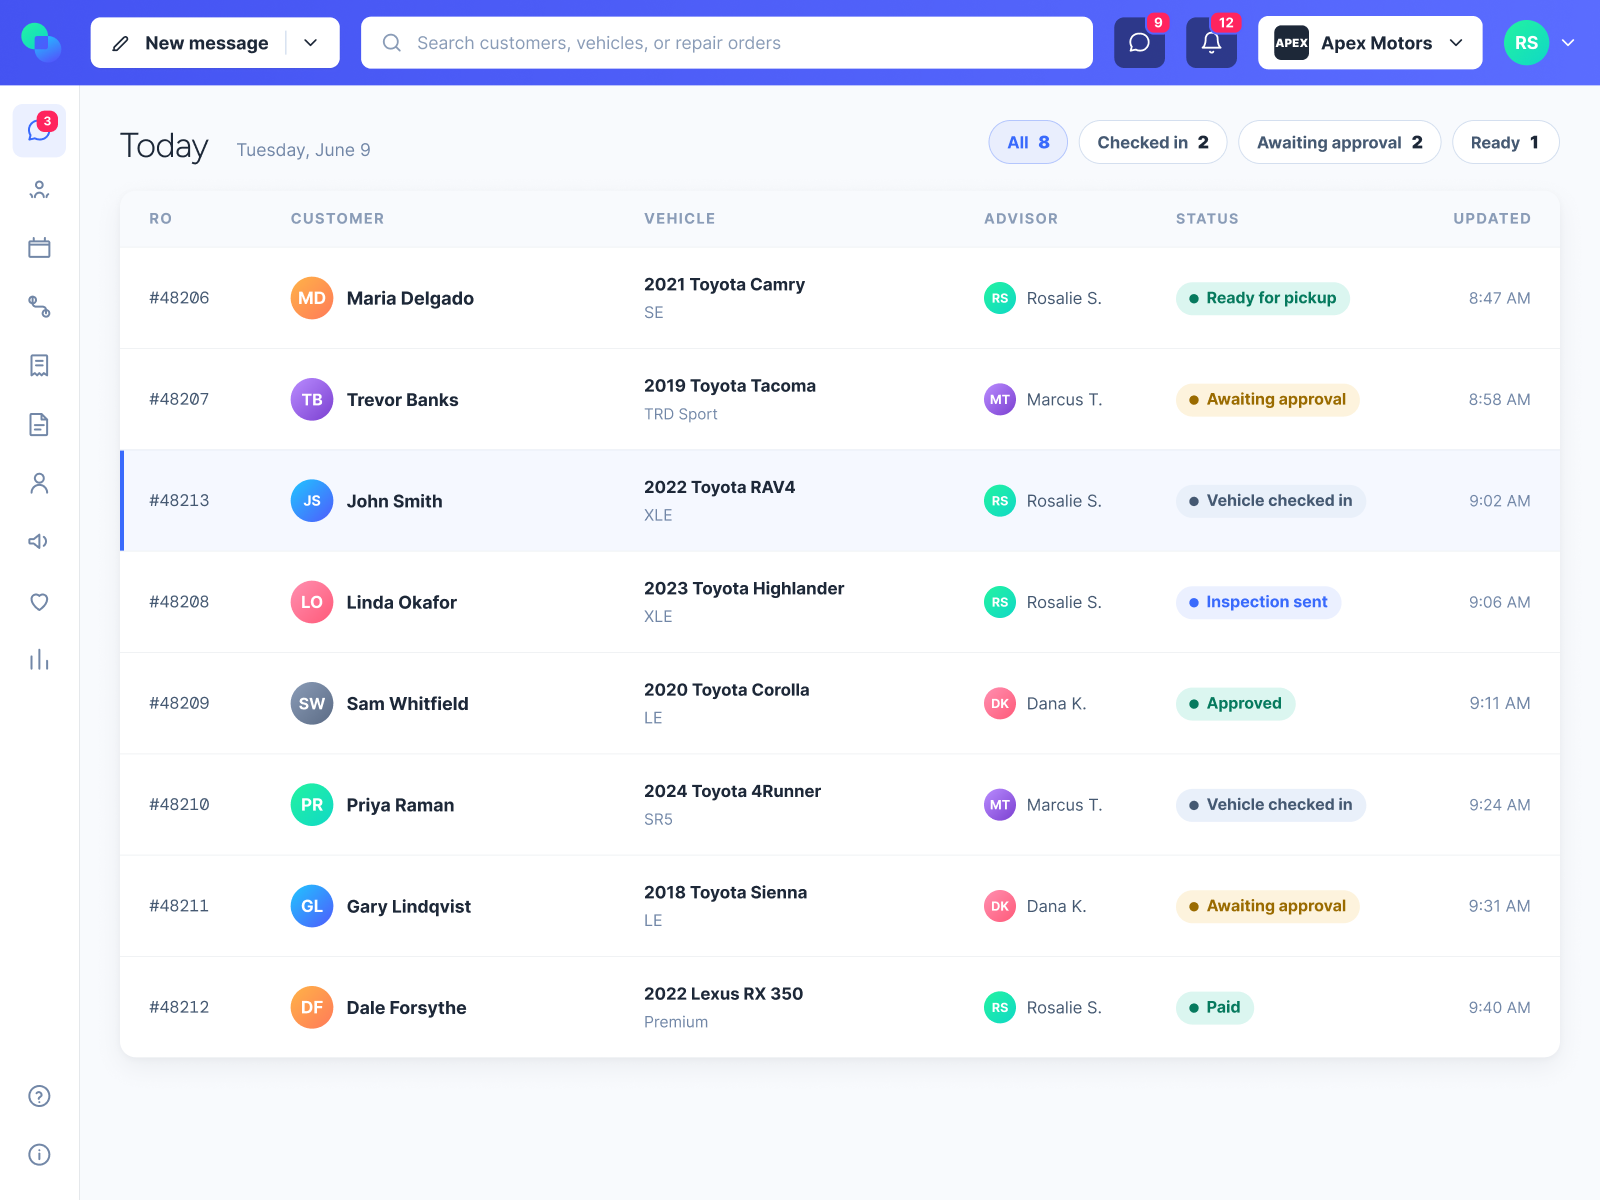
The data comes from Kimoby's Service Lane OS, across 871 dealership accounts in North America: 773 in Canada and 98 in the United States. We're the vendor. Better you hear that from us here than find it out halfway through, and the limitations are laid out at the end.
29 million
messages a year, 1.8 million outbound monthly
154,003
appointments booked from outbound campaigns
$50.5 million
campaign-attributed service revenue
Conversation coverage across the platform runs from 1% at the tenth percentile to 60% at the ninetieth. Blended customer pay per repair order rises with it at $192.57 per hundred points of coverage. All of these stores run the same software, so the gap is execution, which also means it's available to anyone willing to work the process.
Adoption follows a consistent shape across several hundred implementations: messages start flowing in the first week, advisors trust the system over their personal phones within a month, revenue velocity becomes measurable around month three, and retention patterns show up by month six.
No dealer principal sits down and decides to leave customers in the dark.
It happens on its own: a DMS built for a different job, personal cell phones filling the gaps, verbal handoffs that depend on somebody remembering. From the customer's side, the result is the same as if it had been a decision.
Six minutes against twenty-three hours. That gap repeats on every repair order in the lane.
Frequently asked questions
What is the cost of silence in a dealership service department?
It's the gap between what a store earns per repair order and what comparable stores selling the same brand earn. Across 871 dealerships and 16.8 million repair orders, repair orders carrying a digital conversation averaged $455.08 in customer pay against $291.12 without one, a difference of $163.96 on every repair order.
How long does it take a customer to approve additional service work?
When the estimate arrives digitally with photos and line items, the median time to approval is 6 minutes, with 88.2% approved within an hour. Phone-based approvals average 22 to 23 hours by comparison.
Do digital inspections and estimates increase repair order value?
Repair orders with a digital customer conversation averaged $455.08 in customer pay versus $291.12 without one, a difference of $163.96 per RO across 3,999,548 conversation-linked repair orders. This is an observed correlation rather than a controlled experiment: larger jobs naturally generate more communication.
What is the average customer pay per repair order by brand?
It ranges from $217.40 at Kia stores to $966.41 at Porsche stores, a 4.4x spread across thirty brands. Toyota averages $278.54, Honda $294.12, Chevrolet $297.18, Ford $360.07, Mercedes-Benz $621.48. Benchmarking against a platform-wide average is misleading, because what a repair order is worth depends heavily on what you sell.
What percentage of dealership service customers want photo or video inspections?
64% of service customers want photo or video documentation alongside their multi-point inspection, according to J.D. Power's 2026 U.S. Customer Service Index Study. Only 26% of mass-market customers and 44% of premium customers actually receive it.
What is a Dealership Engagement System?
A Dealership Engagement System (DES) is a single platform that runs the entire service lane customer interaction, from drop-off through inspection, estimate, approval, payment and follow-up, connected to the DMS but distinct from it. The DMS is a system of record for what already happened. A Dealership Engagement System manages what happens next.
How much is a returning lapsed customer worth?
A customer who returns after an absence of thirteen months or more spends $549.28 on that visit, against $320.76 on every other repair order, because they arrive with deferred work. Across 871 stores, reactivation accounts for between 1% and 7% of repair order volume, and the typical store sits at 4%.
What is a good service retention rate for a dealership?
NADA targets 72% year-over-year cohort retention. Across the 871 dealerships in this dataset, retention measured 65.8% on a strict cohort basis and 73.9% when lapsed-customer reactivation is included. For industry context, Cox Automotive's 2025 study found retention among owners of vehicles two years old or newer fell from 72% in 2023 to 54% in 2025.
Methodology and limitations
Platform data was drawn from the Kimoby Service Lane OS analytics platform for the twelve months ending February 2026, covering 16,849,842 repair orders at 871 dealership accounts that wrote at least one repair order in that window. Repair order values reflect customer pay unless noted as CP+W. Retention uses a NADA-comparable cohort method: unique customers in Period A (March 2024 to February 2025) who returned in Period B (March 2025 to February 2026).
On causation
The revenue velocity findings represent observed patterns, not controlled experiments. Higher-value repair orders plausibly generate more communication on their own. Job complexity, vehicle age, brand mix and geography are all uncontrolled confounders. We present the pattern at scale, name the confounders, and leave the causal question open.
On the brand benchmark
Brand figures are repair-order-weighted averages by vehicle make across thirty brands. Truck and variant designations were merged into their parent make, and case variants of the same make were combined. Repair orders with no make recorded (560,766) and discontinued brands with no surviving franchise (Pontiac, Oldsmobile, Saturn) are excluded.
One caveat worth stating plainly: the make field is written differently by different dealer management systems, and the variants do not behave the same way. Repair orders recorded as "Toyota" average roughly three times those recorded as "TOYOTA", which almost certainly reflects a different population of stores rather than a different kind of Toyota. Merging them is the least bad option, and it means brands with a large share of mixed-case records carry more uncertainty than their headline figure suggests.
A franchise selling more than one brand will sit between its brands' averages, and stores with unusual job mix will sit outside their brand's range for reasons that have nothing to do with communication. The benchmark is a starting point for a conversation, not a verdict.
On the coverage relationship
Blended customer pay per repair order rises with conversation coverage at $192.57 per hundred points, fitted across coverage deciles at R² 0.949. That fit is on decile averages rather than individual stores, so aggregation inflates it and real scatter is considerably wider. The calculator therefore reports a range, and treats it as a claim about the population rather than a prediction about your store.
On the threshold
The threshold described in the velocity tax section was measured by sorting stores into deciles by conversation coverage and comparing average customer pay on conversation against non-conversation repair orders within each decile. The gap is $74 in the bottom two deciles and averages $215 across deciles three to ten, with no decay at the top. Decile boundaries are unequal in store count because a large number of accounts sit near zero coverage.
The decile analysis covers a wider set of accounts than the 871 cited elsewhere in this report. The headline figure counts accounts that wrote at least one repair order in the twelve-month window; the decile and reactivation analyses include accounts outside that filter. Where a section reports a store count, it is the count for that specific analysis.
On the calculator
Figures entered into the benchmark calculator are stored against the contact record in Kimoby's CRM. Repair order volume is collected and stored monthly, and customer pay per repair order is stored in its own field, separate from the total repair order value the earlier DES score calculator collected, so the two are never compared as if they measured the same thing.
On the source
This data comes from one vendor's platform, which is both the reason it exists at scale and a limitation on how it should be read. Kimoby customers are a self-selected group: dealerships that chose to invest in service lane engagement are unlikely to be representative of dealerships generally. The absolute numbers should be read as what is achievable by stores already committed to this, not as an industry average.
On the phone
Voice data in Section 2 comes from a single named dealership rather than platform aggregate. Platform-wide voice figures are being collected and will appear in a future edition.
Industry benchmarks cited
NADA, Cox Automotive's 2025 Service Industry Study, J.D. Power's 2024 and 2026 U.S. Customer Service Index studies, J.D. Power's 2024 U.S. Aftermarket Service Index Study, and Marchex call analytics.
© 2026 Kimoby Inc. All rights reserved. Dealership Engagement System (DES)™ is a trademark of Kimoby Inc.